Updated 12 March 2005

Power Measurements for a Sherwood XA-2105BP Car Power Amplifier
Rev (-) 12 Mar 2005
© 2005 By Joe Roberts
Introduction: This article shows some basic measurements of power capabilities for a small (by today's
standards) car power amplifier. The amplifier used was a Sherwood XA-2105BP, it is one I have had hanging around (never
used) for about 10 years. It is rated at 45 watts per channel at 4 ohms.
Method: The amplifier was connected up to test equipment on a lab bench. A regulated power supply (variable
voltage) capable of about 50 amps was used to power the amplifier. A signal generator was used to apply an identical signal
to both input channels. The outputs of the amplifier were connected to 4 ohm 100 watt resistive dummy loads. An
oscilloscope was used to monitor the output waveform and a true RMS voltmeter was used to make voltage measurements of both
the power supply used to power the amplifier and output channels of the amplifier. The output of the amplifier was monitored
for various signal frequencies and input levels.
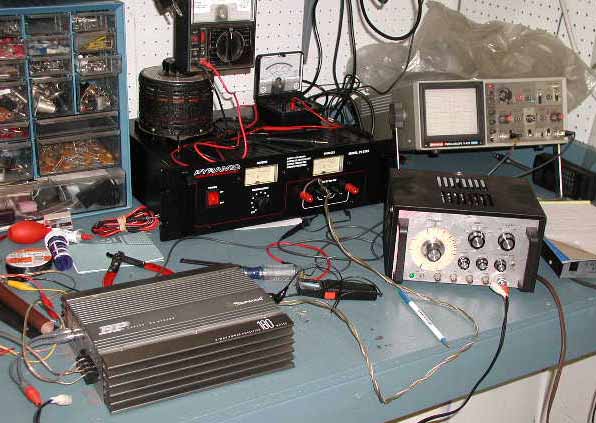 A photo of the somewhat messy lab bench showing some of the equipment used for these tests.
Results: I measured the power output of this amplifier (both channels driven) for various levels of DC
supply voltage to the amplifier. In each case the amplifier was fed a 1000 Hz signal and the amplitude was adjusted so that
the output of the amplifier was just at the threshold of clipping. The results are as follows:
- DC Supply Voltage at 13.8 VDC; Voltage at output = 13.74 VRMS; power output = 47.2 watts (each channel)
- DC Supply Voltage at 12.0 VDC; Voltage at output = 12.28 VRMS; power output = 37.7 watts (each channel)
- DC Supply Voltage at 14.4 VDC; Voltage at output = 14.94 VRMS; power output = 55.8 watts (each channel)
What do these results show? Clearly, when the DC supply voltage to the amplifier is higher, the maximum output power
increases. Normally, this car amplifier would be installed in a car (not a lab bench). When a car engine is off the battery
voltage is closer to 12 VDC; when the engine is on and the alternator is running (charging the battery), the voltage is more
likely to be in the 13.8 VDC range. So, your system can play louder when the engine is running. Basically, a 15% increase
in DC supply voltage translates to a 25% increase in power.
I also measured (with the DC supply voltage at the standard 13.8 VDC level) the output of this amplifier at some frequency
extremes. For each frequency, the input signal was increases until the amplifier just reached the threshold of clipping.
The results are as follows:
- Input frequency = 1000 Hz; Voltage at output = 13.74 VRMS; power output = 47.2 watts (each channel)
- Input frequency = 20 Hz; Voltage at output = 14.40 VRMS; power output = 51.84 watts (each channel)
- Input frequency = 20,000 Hz; Voltage at output = 13.71 VRMS; power output = 47.0 watts (each channel)
Somewhat surprisingly, this particular amplifier actually puts out more power at 20 Hz then it does at 1000 Hz (this is
not usually the case for most amplifiers).
Oscilloscope Displays for Various Clipping Conditions: Below are some photos of actual oscilloscope displays
that show real world examples of clipping. These photos are useful in that they show how clipping behavior of real world
amplifiers varies as a function of signal frequency. The photos below represent the clipping behavior of most (audio power)
amplifiers available today. Each photo has descriptive notes.
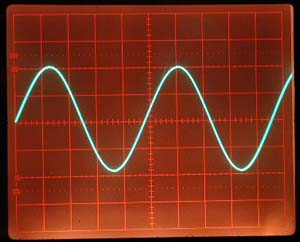
Figure 1. Amplifier output with 1000 Hz signal just at the threshold of clipping. The signal is clean and shows no
significant aberrations.
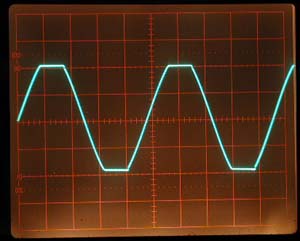
Figure 2. Amplifier output with 1000 Hz signal driven into slight clipping. Note that the waveform peaks have been
flattened out. This level of clipping would be
clearly audible but not too hideous (but then again few people listen to sine waves).
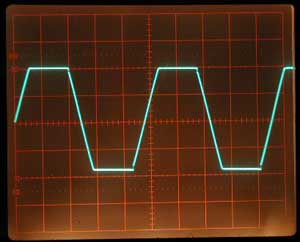
Figure 3. Amplifier output with 1000 Hz signal driven into significant clipping. The waveform peaks have been
flattened out more. This level of clipping with normal music would start to become fairly noticeable (the music would sound
compressed).
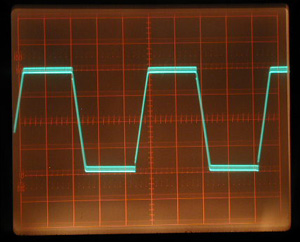
Figure 4. Amplifier output with 1000 Hz signal driven into very bad clipping. The waveform is starting to more
closely resemble a square wave. The sound quality at this point would be objectionable to most any listener. Also, clipping
of this magnitude is sending a big invitation to speaker damage!
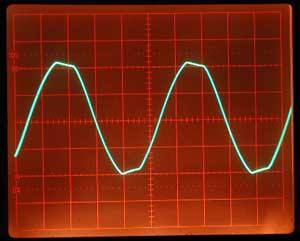
Figure 5. Amplifier output with 20 Hz signal driven into slight clipping. Note how this plot differs from that of
Figure 2. The amount of clipping is similar, but notice the waveform? The clipped portion is slanting downward with time
instead of holding fairly flat. This is very typical of clipping behavior for low frequencies. Why? The 20 Hz waveform is
so long (time wise) compared to the mid band frequency waveform that the power supply is having a hard time holding up the
rail voltage. Basically the rail voltage is being sucked down as the storage capacitors drain their charge (in an attempt to
provide the power needed). The very best amplifiers will hold this slant to a minimum. Testing amplifiers at this frequency
really puts the power supply to the test!
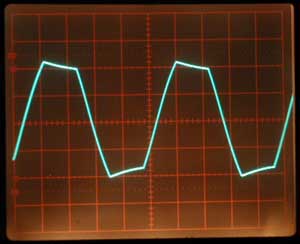
Figure 6. Amplifier output with 20 Hz signal driven into bad clipping. The waveform clipping characteristic (clip
slant) is quite a bit more pronounced now. Clearly the amplifier's power supply is having a harder time with this low (20
Hz) signal as compared to the relatively "easy" 1000 Hz signal used in the first test!
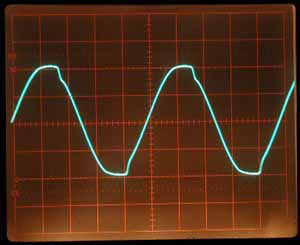
Figure 7. Amplifier output with 20,000 Hz signal driven into slight clipping. Note that this plot is different from
both the plots for 1000 Hz and 20 Hz signals. Instead of a "flat top" or "slant" clip, the waveform is taking on other
distortions. This too is quite common for many amplifiers. Frequency extremes basically tax the performance of most
amplifiers. For high frequencies, more often the clipping behavior is similar to what is starting to occur above. In this
case the power supply of the amplifier is not the major cause for the distortion; more likely the circuit design is the
reason. Making things work (well) at high power and high frequencies simultaneously is harder to do.
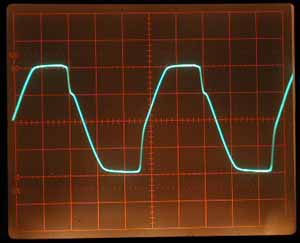
Figure 8. Amplifier output with 20,000 Hz signal driven into bad clipping. Notice how different this waveform looks
as compared to the ones in Figures 2 and 6. The amount of clipping is roughly the same, but the waveform sure looks
different! Again, clipping at high frequency extremes often produces waveforms with strange looking artifacts. Ironically,
if one were to listen to this signal (20,000 Hz, assuming they can hear that high), it might not sound too distorted! The
reason? The distortion products would be too high for any human to hear. What you might hear instead are some lower
frequency artifacts.
Conclusions: Measurements were made on a "typical" low to mid power amplifier intended for use in a car
audio system. The behavior of this amp is similar to many (but not all) amplifiers intended for car audio use. We can
conclude:
- The amplifier's maximum output power capability is higher when the DC supply voltage is higher (running on battery alone
vs. when the engine is running).
- The amplifier performs best at mid band frequencies. Clipping behavior at frequency extremes shows that the waveform
degrades in a less controlled manner than at mid frequencies. Clipping at low frequency extremes is largely due to the power
supply being heavily loaded while at high frequency extremes circuit design is more of a factor.
Back links and E-mail
E-mail to Joe Roberts
Joe's home page...